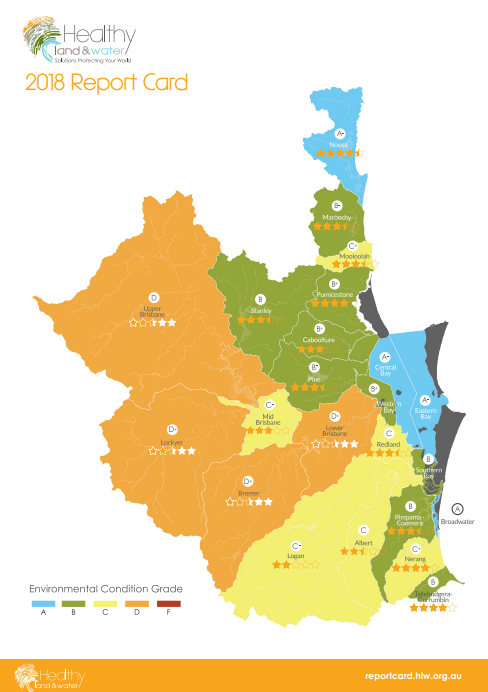
SEQ's Report Card
Tracking & reporting environmental data for the region
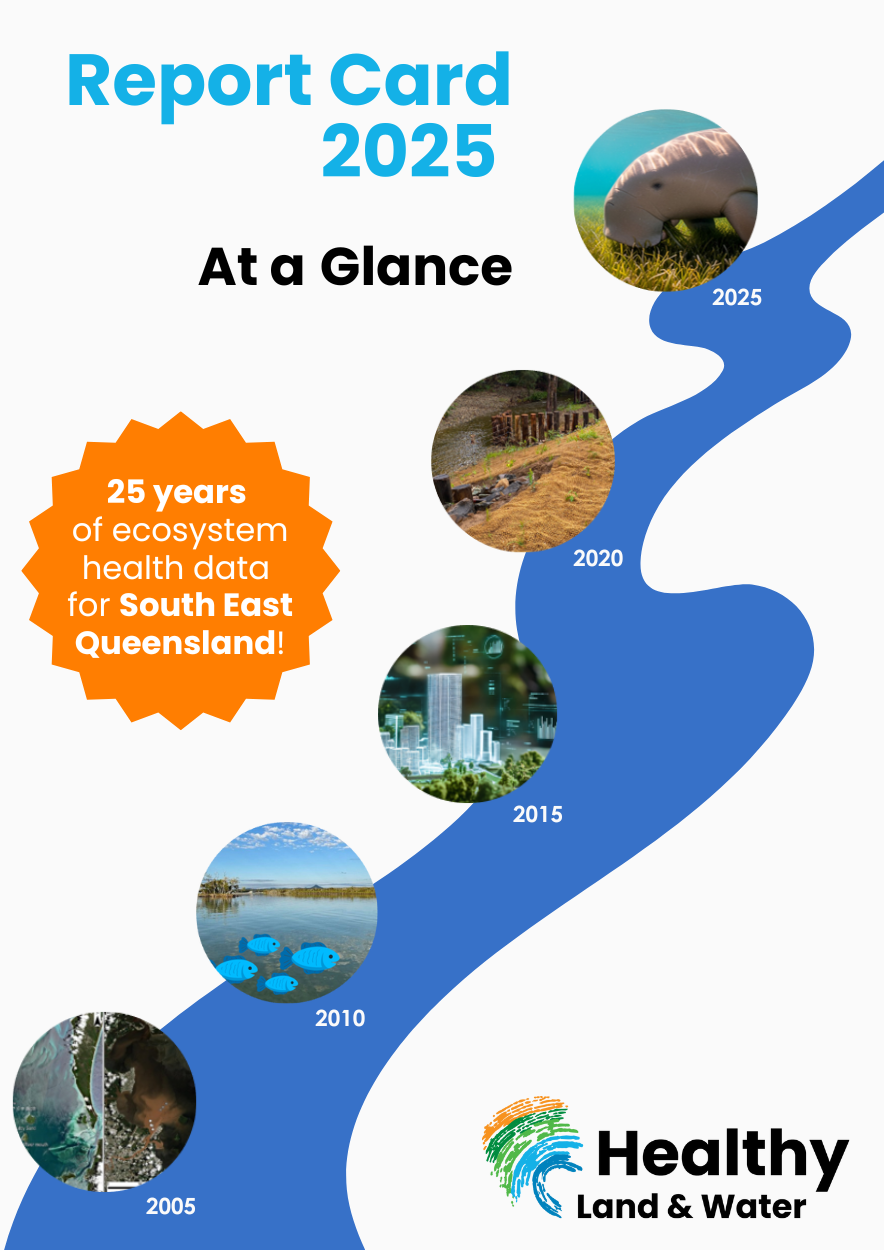
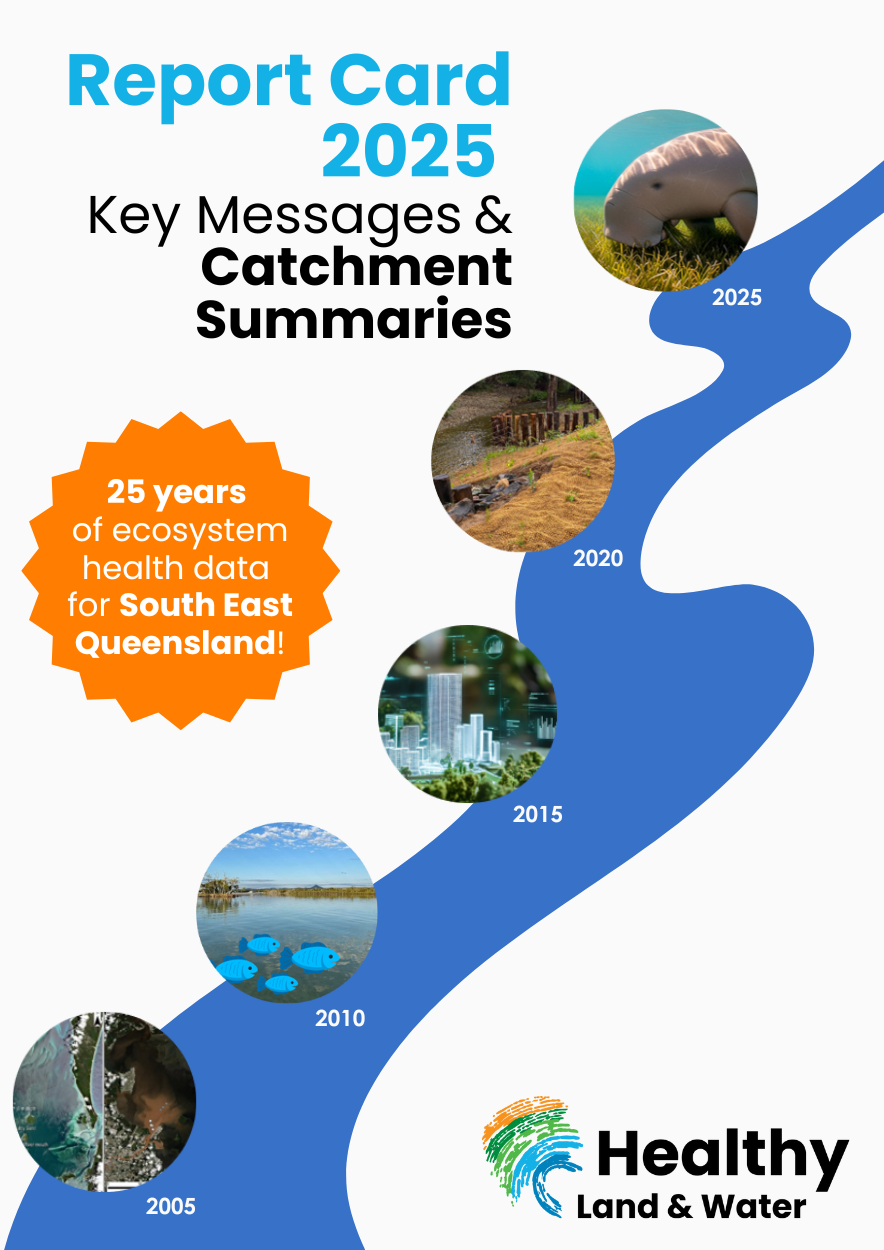
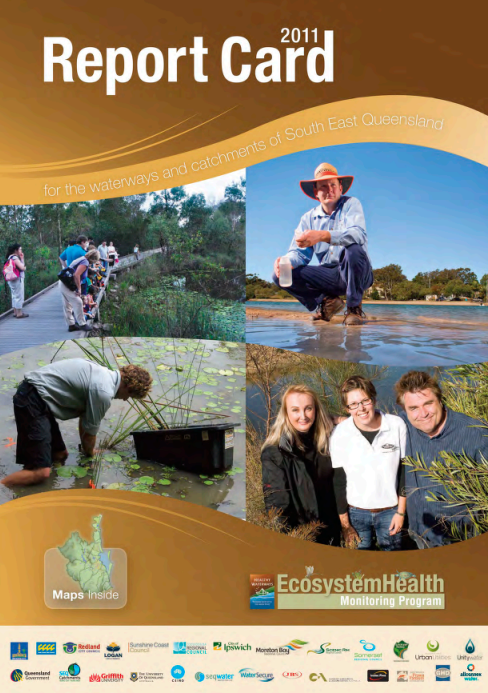
Report Card: 25+ years data on the region
- Report Card
- Visit the online tool
- How it is funded?
- Report Card downloads
- Technical report downloads
Long-running data driving decisions
Informing action
Decision makers have 25+ years of data on South East Queensland’s environment, thanks to the long running Report Card initiative for the region.
This arms us with amazing baseline data to help inform good decisions:
- It highlights where more action is needed.
- It shows where actions are working.
- It informs best bang for buck spend to prioritise investment across the region.
Why the data is essential
There are a few key things in SEQ which are driving the pace of action needed to protect our beautiful region:
- Strong population growth: SEQ is one of the Australia’s fastest growing regions. Our region’s incredible biodiversity, climate and liveability had made our region an attractive place for people to live, work and play. This brings with it the pressures of developing the area to accommodate the additional people, and better using our existing land and existing spaces for more people.
- Climate change exposed: With more frequent and intense weather events on the cards, our landscapes will increasingly not have the time to recover in the same way it used to. Proactive investment is needed to build our region’s resilience to better withstand the extremes.
- Biodiversity hotspot: SEQ is one of the most biodiverse regions in Australia. We are also home to several internationally recognised areas which have been listed as Ramsar and UNESCO sites of significance and protection. We are also conserving many of Australia’s threatened species, while contenting with our growing population and more extreme weather events.
There is limited time and resources to tackle these big issues, which makes having long-term data essential in tracking what is going on, what benefits best, what needs protection and where to channel the investment for the biggest return for our region (we often refer to the environment as our biggest stakeholder).
Go to the online tool
Check out the Report Card website:
- Full key messages for the year.
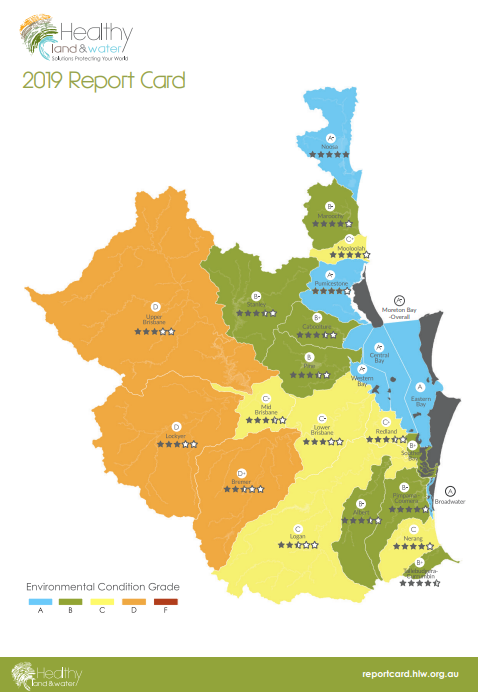
- Investigate results by catchment:
- Environmental.
- Socio-economic.
- Cultural (new this year).
- Check out actions and great stories of projects that are delivering results.
- A range of deeper dive resources.
- ...and more
How is it funded?
Having access to this essential data is only thanks to the leadership of a team of partners who proactively band together to fund this monitoring and reporting work for the region each year.
As you can imagine, it is tough ask funding a program which gives a scorecard which is not always favorable - especially when there are disaster-scale floods and things outside of your control.
But these groups across South East Queensland have continued to invest over time, saying that with all the pressures of population growth and climate change on their beautiful and biodiverse areas, it is essential to know what's happening and how best to protect it. This way they can be better armed to fix emerging issues and build resilience into their areas.
We thank each and every one of our Report Card partners for their vision and leadership in making this vital program for the region possible.
|
|
|
|
|
|
|
|
|
|
|
|
|
|
|
|
|
|
|
|


Report Card: document library
If you are not looking to use the online Report Card tool, and would prefer to jump into the written up summaries of the results for the past few years, scroll down to see and download them here.


Report Card: technical reports
Level 11, 240 Queen St, GPO Box 735
Meanjin (Brisbane) QLD 4001, Australia
Monday - Friday 8.30am - 5.00pm
Healthy Land & Water Ltd ABN 91 115 662 989
About Us
What's on
Our Impact
Contact us
Phone: (07) 3177 9100
Email: info@hlw.org.au
We acknowledge that the place we now live has been nurtured by the Traditional Custodians of this Country for tens of thousands of years, and that their physical, cultural and spiritual custodianship of our land, water and skies is ongoing.
